What each model costs
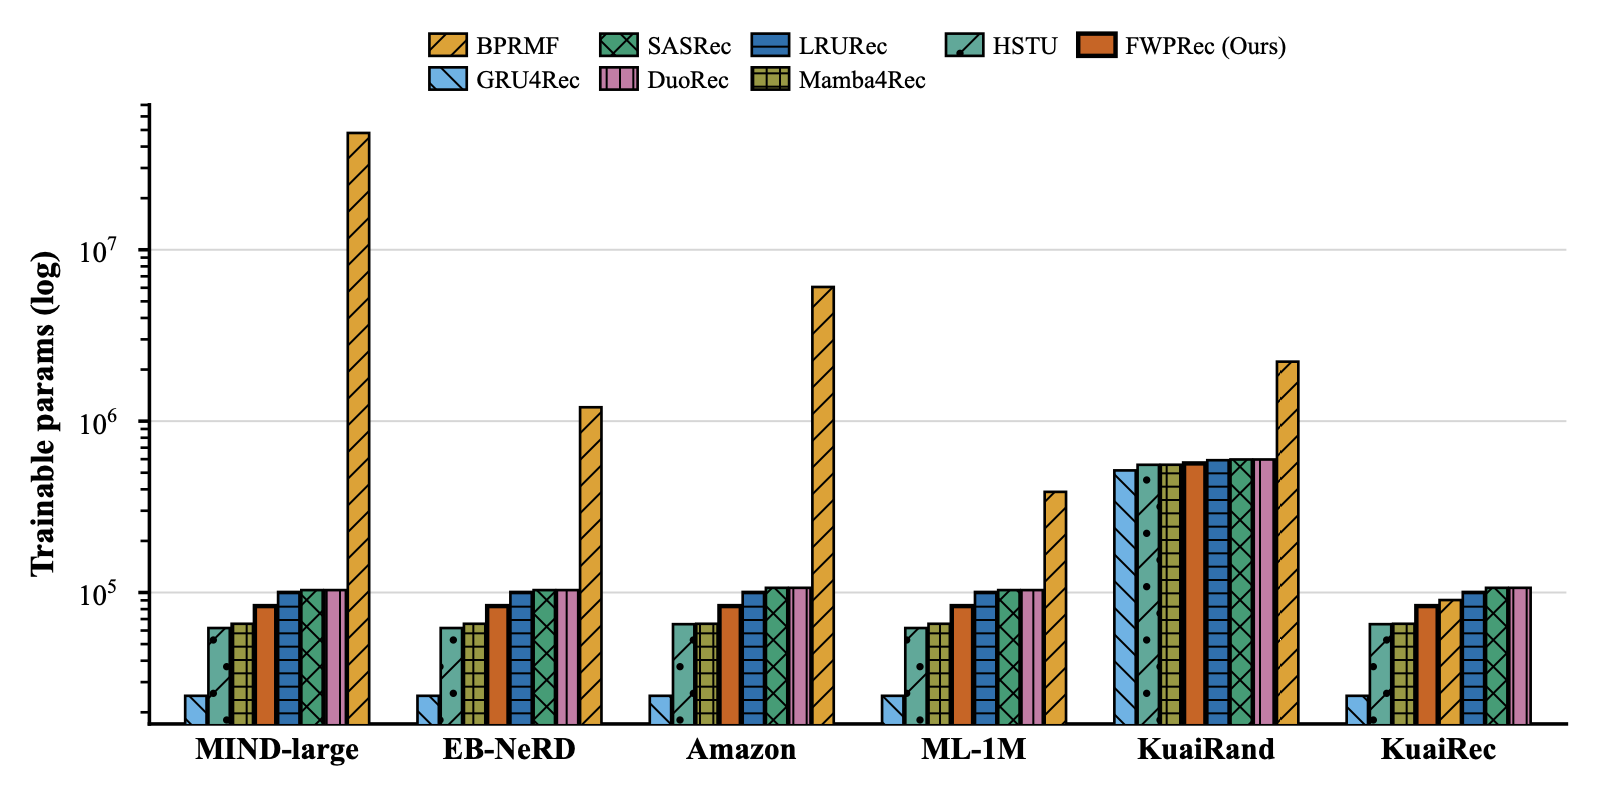
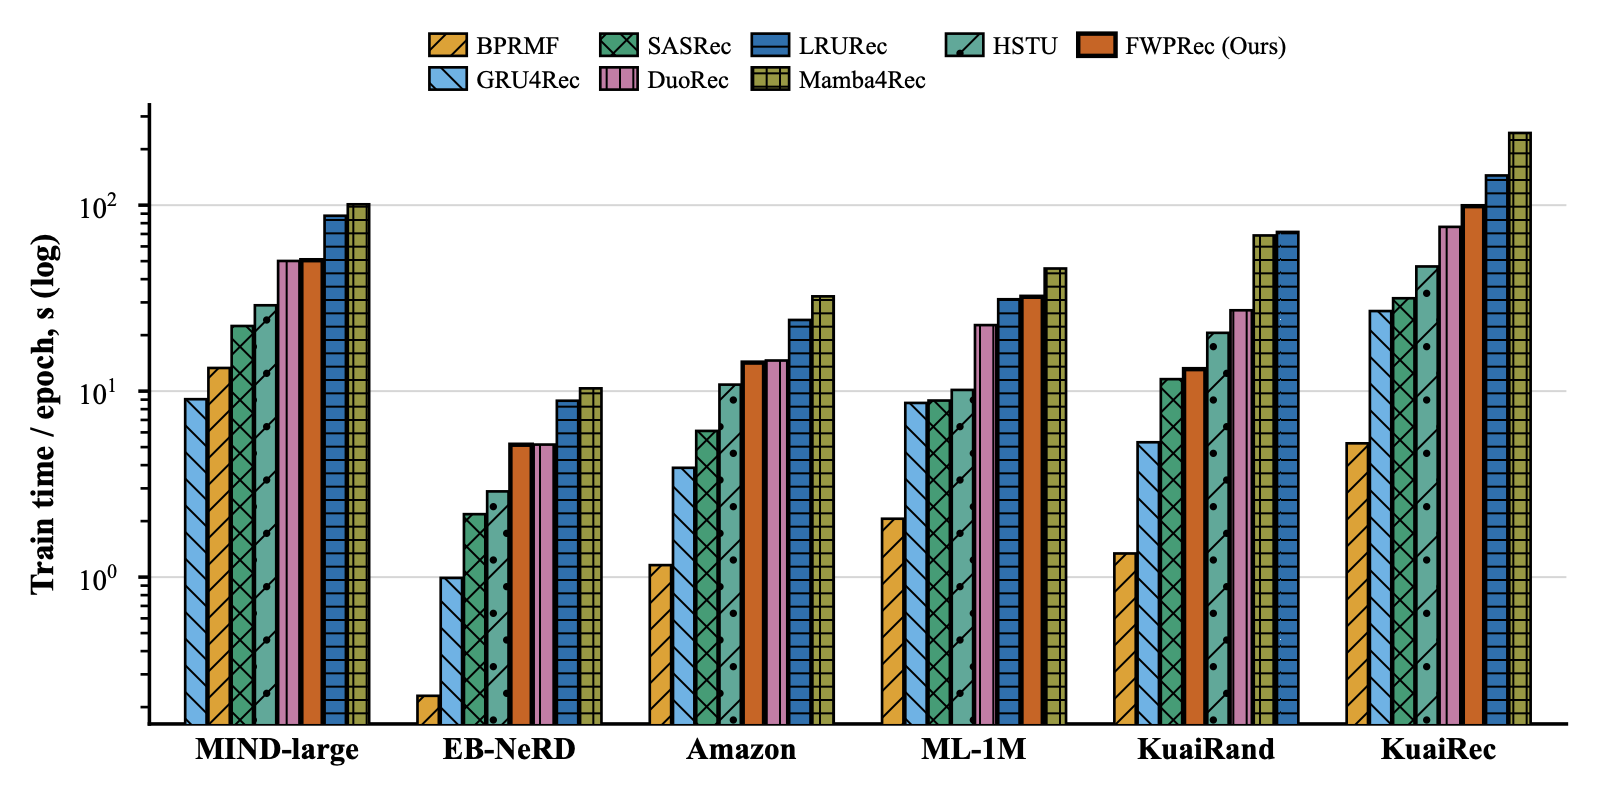
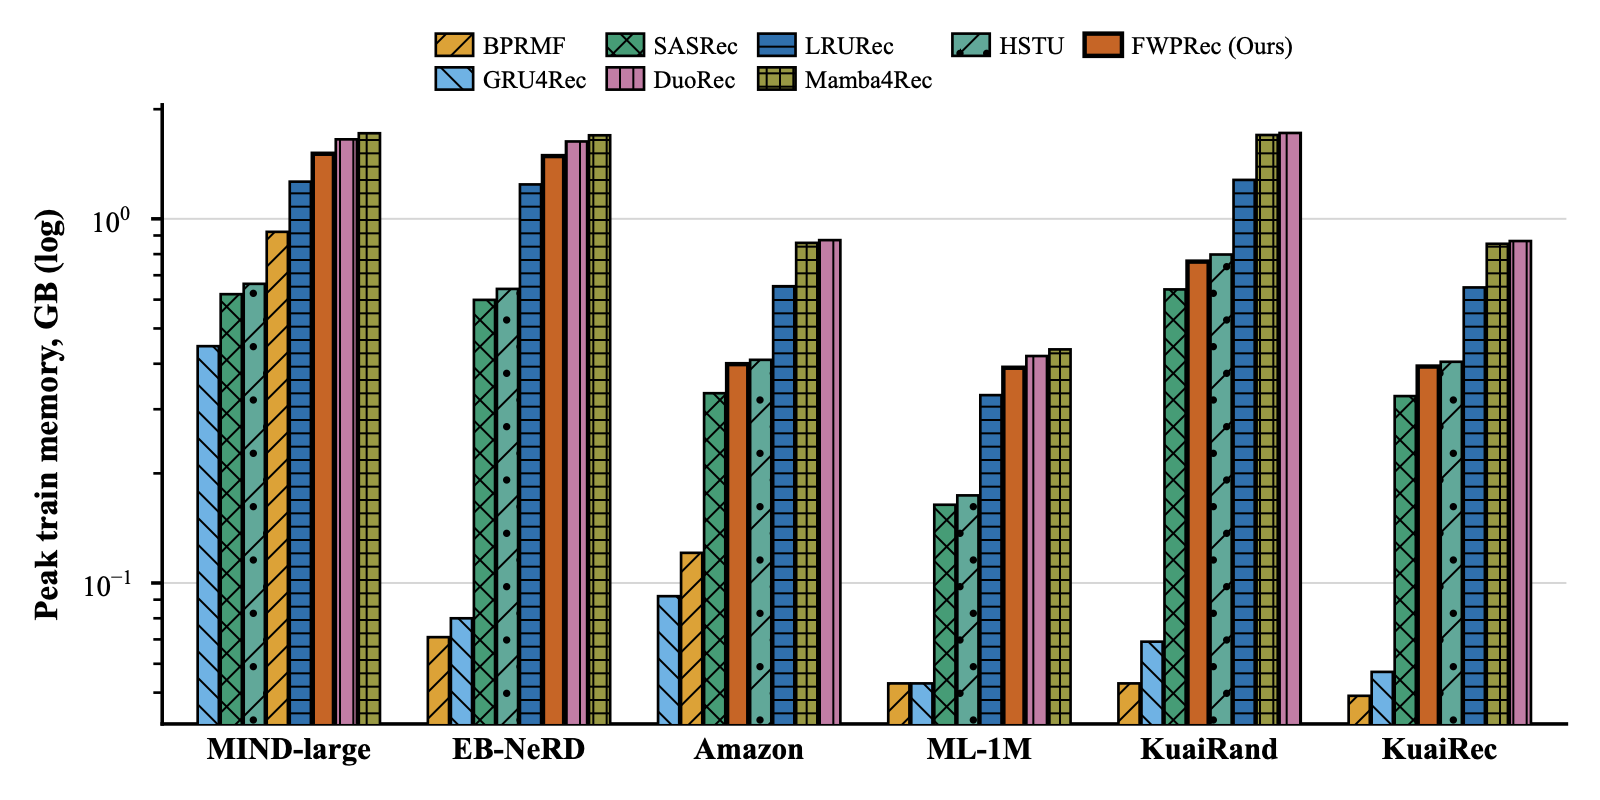
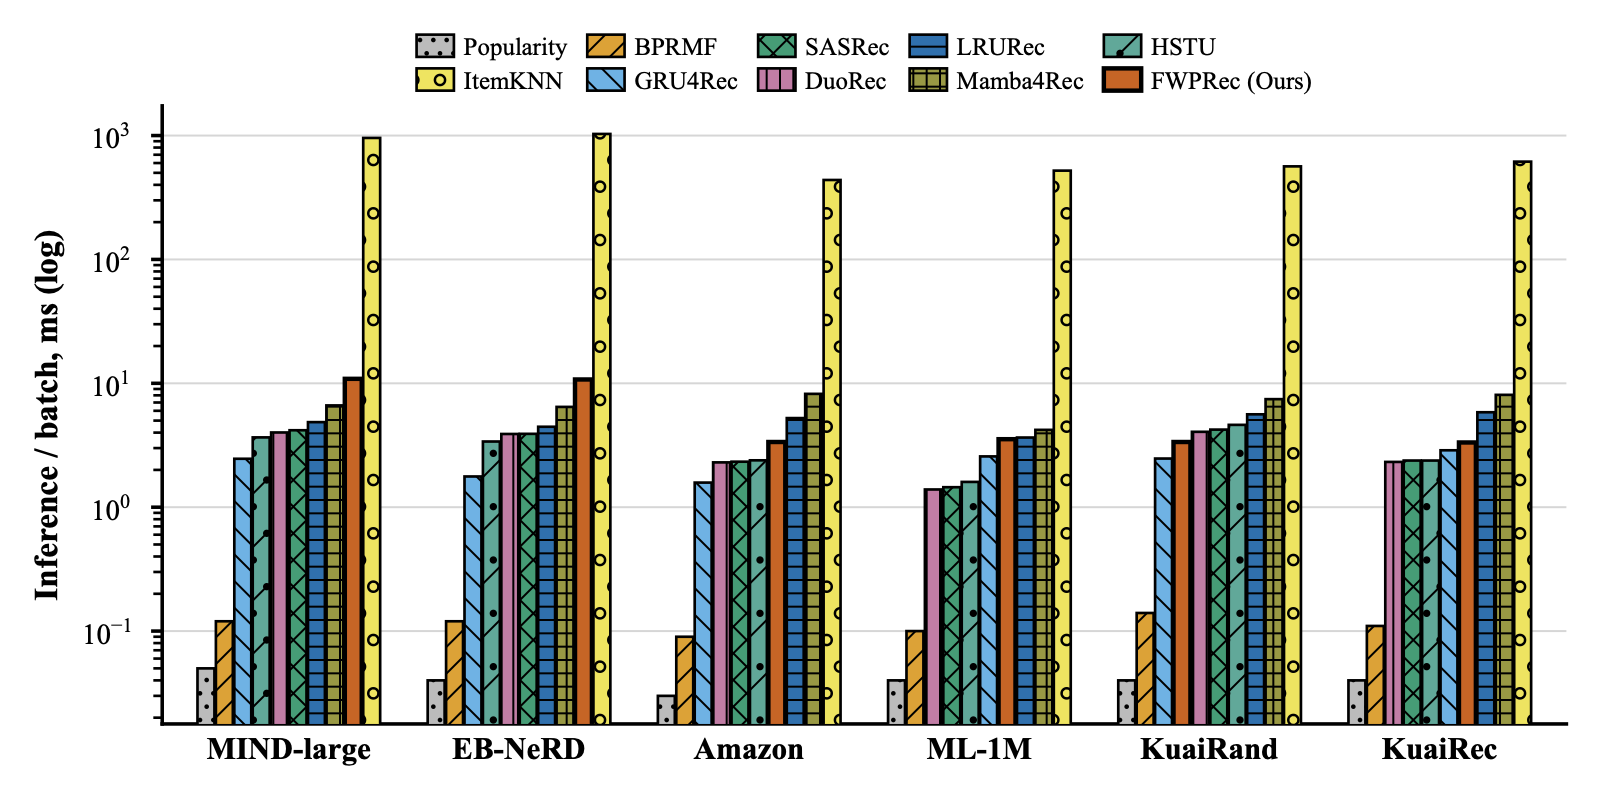
The same measurements efficiency-focused recommender papers publish — trainable parameters, peak GPU memory, training time per epoch, and inference time per batch — taken on one idle GPU with each model in its exact published main-table configuration. Timings are medians over repeated, synchronized steps; the last column is the real wall-clock of the published three-seed runs.
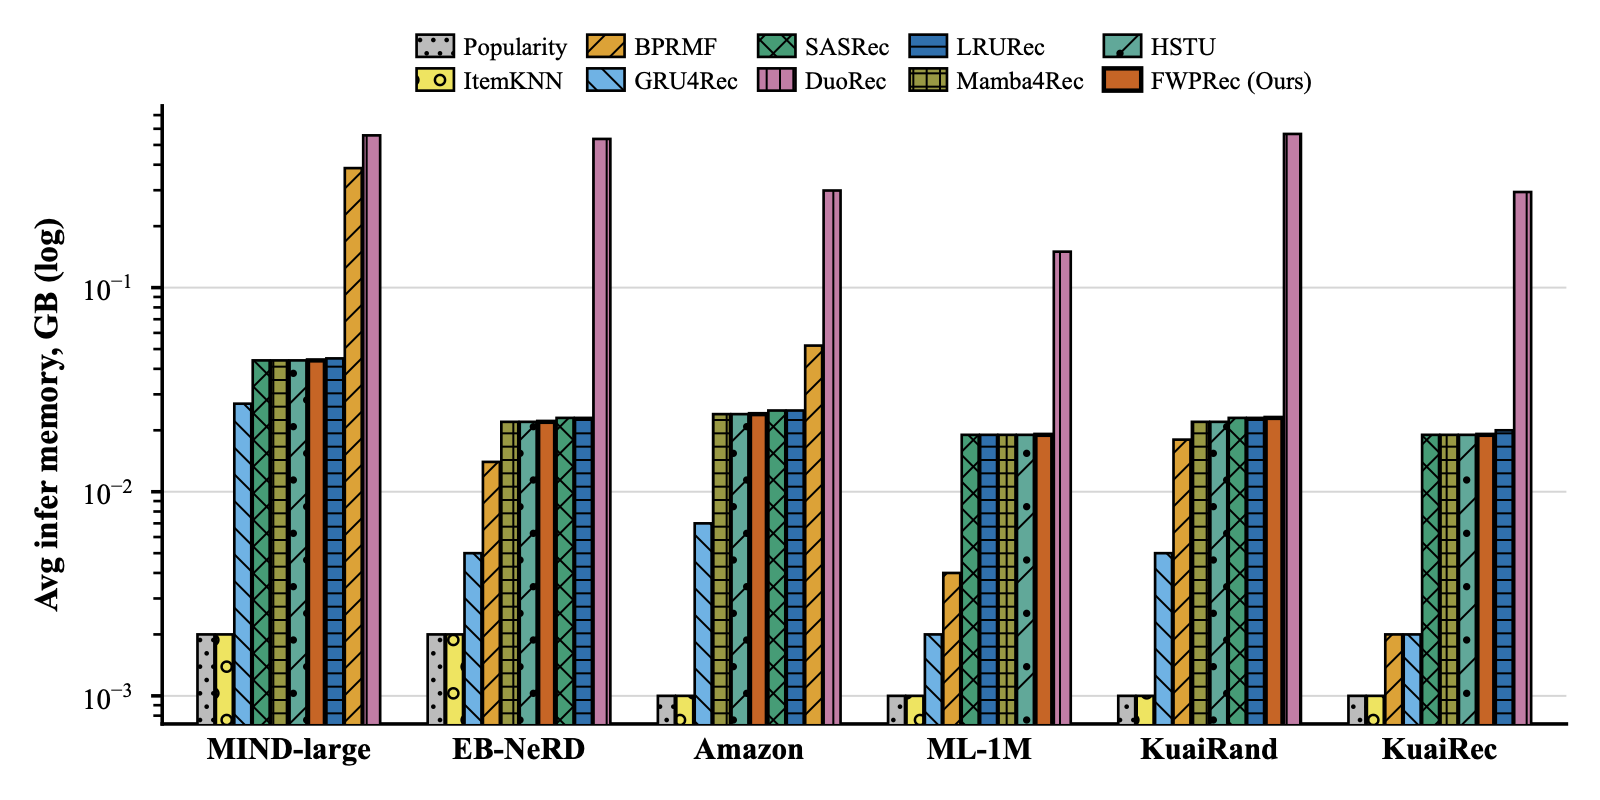
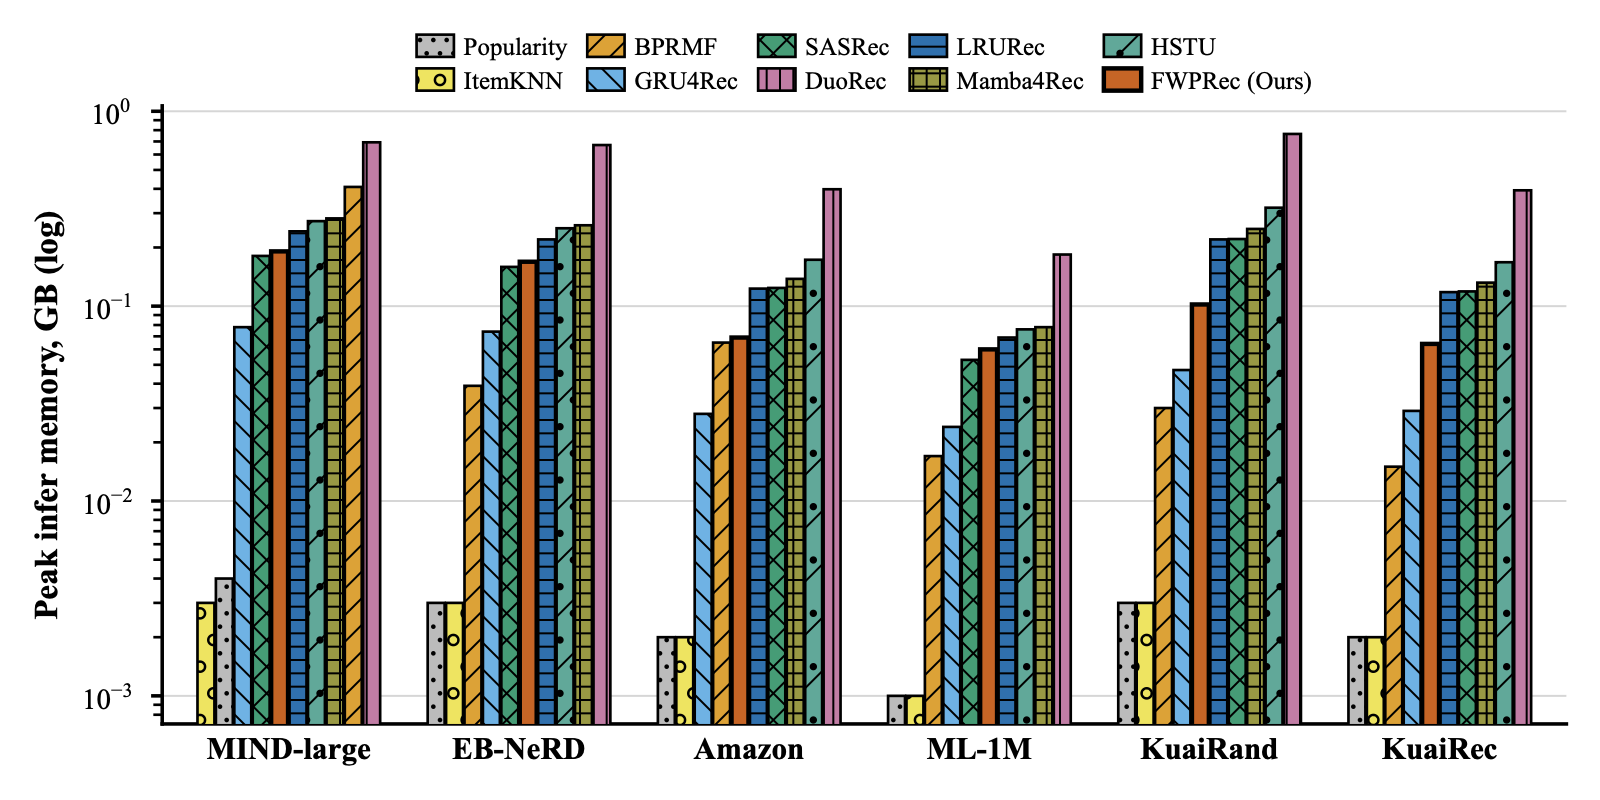
The notepad's inference cost sits between the light recurrent models and the attention stack, with the smallest inference memory of any adaptive model — its per-user state is bounded, so serving memory stays flat while attention models grow with history. Training is mid-pack: the write loop makes epochs slower than GRU4Rec's but comparable to the state-space and contrastive baselines. The fastest trainer everywhere is GRU4Rec; the slowest is Mamba4Rec's unfused scan.
Trainable parameters · cheapest first · FWPRec in blue
Within each dataset, bars run cheapest to costliest left to right, and heights are on a log scale — values span up to three orders of magnitude, so a linear axis would hide every smaller model. The tallest bar in a group is always full height. Hover any bar for its exact value.
Training time per epoch (s) · cheapest first · FWPRec in blue
Within each dataset, bars run cheapest to costliest left to right, and heights are on a log scale — values span up to three orders of magnitude, so a linear axis would hide every smaller model. The tallest bar in a group is always full height. Hover any bar for its exact value.
Peak training memory (GB) · cheapest first · FWPRec in blue
Within each dataset, bars run cheapest to costliest left to right, and heights are on a log scale — values span up to three orders of magnitude, so a linear axis would hide every smaller model. The tallest bar in a group is always full height. Hover any bar for its exact value.
Inference time per batch (ms) · cheapest first · FWPRec in blue
Within each dataset, bars run cheapest to costliest left to right, and heights are on a log scale — values span up to three orders of magnitude, so a linear axis would hide every smaller model. The tallest bar in a group is always full height. Hover any bar for its exact value.
Average inference memory (GB) · cheapest first · FWPRec in blue
Within each dataset, bars run cheapest to costliest left to right, and heights are on a log scale — values span up to three orders of magnitude, so a linear axis would hide every smaller model. The tallest bar in a group is always full height. Hover any bar for its exact value.
Peak inference memory (GB) · cheapest first · FWPRec in blue
Within each dataset, bars run cheapest to costliest left to right, and heights are on a log scale — values span up to three orders of magnitude, so a linear axis would hide every smaller model. The tallest bar in a group is always full height. Hover any bar for its exact value.
MIND-large · batch 1024
| Model | Trainable params | Train s/epoch | Peak train GB | Infer ms/batch | Avg infer GB | Peak infer GB | Total train min† |
|---|---|---|---|---|---|---|---|
| Popularity | 0 | · | · | 0.05 | 0.002 | 0.004 | 3.7 |
| ItemKNN | 0 | · | · | 956.56 | 0.002 | 0.003 | 15.7 |
| BPRMF | 48.03M | 13.32 | 0.921 | 0.12 | 0.385 | 0.409 | 12.1 |
| GRU4Rec | 25K | 9.05 | 0.447 | 2.46 | 0.027 | 0.078 | 10.6 |
| SASRec | 103K | 22.4 | 0.621 | 4.18 | 0.044 | 0.181 | 11.2 |
| DuoRec | 103K | 50.11 | 1.653 | 4.01 | 0.557 | 0.693 | 14.9 |
| LRURec | 101K | 87.72 | 1.265 | 4.86 | 0.045 | 0.242 | 22.9 |
| Mamba4Rec | 66K | 101.07 | 1.718 | 6.63 | 0.044 | 0.282 | 18.7 |
| HSTU | 62K | 28.95 | 0.663 | 3.66 | 0.044 | 0.273 | 9.5 |
| FWPRec (Ours) | 83K | 50.58 | 1.509 | 10.87 | 0.044 | 0.191 | 16.1 |
EB-NeRD · batch 1024
| Model | Trainable params | Train s/epoch | Peak train GB | Infer ms/batch | Avg infer GB | Peak infer GB | Total train min† |
|---|---|---|---|---|---|---|---|
| Popularity | 0 | · | · | 0.04 | 0.002 | 0.003 | 0.9 |
| ItemKNN | 0 | · | · | 1030.21 | 0.002 | 0.003 | 4.4 |
| BPRMF | 1.20M | 0.23 | 0.071 | 0.12 | 0.014 | 0.039 | 1.5 |
| GRU4Rec | 25K | 0.99 | 0.08 | 1.77 | 0.005 | 0.074 | 1.3 |
| SASRec | 103K | 2.18 | 0.599 | 3.91 | 0.023 | 0.159 | 1.4 |
| DuoRec | 103K | 5.16 | 1.631 | 3.9 | 0.535 | 0.671 | 1.2 |
| LRURec | 101K | 8.88 | 1.243 | 4.46 | 0.023 | 0.22 | 1.7 |
| Mamba4Rec | 66K | 10.35 | 1.696 | 6.45 | 0.022 | 0.26 | 1.7 |
| HSTU | 62K | 2.89 | 0.642 | 3.39 | 0.022 | 0.251 | 1.3 |
| FWPRec (Ours) | 83K | 5.15 | 1.487 | 10.74 | 0.022 | 0.169 | 2.2 |
Amazon Video Games · batch 256
| Model | Trainable params | Train s/epoch | Peak train GB | Infer ms/batch | Avg infer GB | Peak infer GB | Total train min† |
|---|---|---|---|---|---|---|---|
| Popularity | 0 | · | · | 0.03 | 0.001 | 0.002 | 0.6 |
| ItemKNN | 0 | · | · | 437.87 | 0.001 | 0.002 | 1.2 |
| BPRMF | 6.06M | 1.16 | 0.121 | 0.09 | 0.052 | 0.065 | 1.2 |
| GRU4Rec | 25K | 3.87 | 0.092 | 1.58 | 0.007 | 0.028 | 1.3 |
| SASRec | 106K | 6.11 | 0.332 | 2.33 | 0.025 | 0.124 | 1.5 |
| DuoRec | 106K | 14.61 | 0.874 | 2.3 | 0.299 | 0.398 | 2.6 |
| LRURec | 101K | 24.14 | 0.653 | 5.24 | 0.025 | 0.123 | 4.1 |
| Mamba4Rec | 66K | 32.33 | 0.859 | 8.22 | 0.024 | 0.138 | 6.1 |
| HSTU | 65K | 10.84 | 0.41 | 2.39 | 0.024 | 0.173 | 2.3 |
| FWPRec (Ours) | 83K | 14.24 | 0.399 | 3.36 | 0.024 | 0.069 | 2.6 |
MovieLens-1M · batch 256
| Model | Trainable params | Train s/epoch | Peak train GB | Infer ms/batch | Avg infer GB | Peak infer GB | Total train min† |
|---|---|---|---|---|---|---|---|
| Popularity | 0 | · | · | 0.04 | 0.001 | 0.001 | 1.2 |
| ItemKNN | 0 | · | · | 520.93 | 0.001 | 0.001 | 4.4 |
| BPRMF | 387K | 2.06 | 0.053 | 0.1 | 0.004 | 0.017 | 2.9 |
| GRU4Rec | 25K | 8.64 | 0.053 | 2.57 | 0.002 | 0.024 | 3.2 |
| SASRec | 103K | 8.9 | 0.164 | 1.45 | 0.019 | 0.053 | 4.0 |
| DuoRec | 103K | 22.65 | 0.42 | 1.39 | 0.15 | 0.184 | 4.7 |
| LRURec | 101K | 31.19 | 0.328 | 3.65 | 0.019 | 0.069 | 7.0 |
| Mamba4Rec | 66K | 45.64 | 0.438 | 4.21 | 0.019 | 0.078 | 8.2 |
| HSTU | 62K | 10.15 | 0.174 | 1.6 | 0.019 | 0.076 | 3.5 |
| FWPRec (Ours) | 83K | 32.16 | 0.39 | 3.54 | 0.019 | 0.06 | 7.2 |
KuaiRand-Pure (IDs) · batch 512
| Model | Trainable params | Train s/epoch | Peak train GB | Infer ms/batch | Avg infer GB | Peak infer GB | Total train min† |
|---|---|---|---|---|---|---|---|
| Popularity | 0 | · | · | 0.04 | 0.001 | 0.003 | 2.5 |
| ItemKNN | 0 | · | · | 563.87 | 0.001 | 0.003 | 2.8 |
| BPRMF | 2.22M | 1.34 | 0.053 | 0.14 | 0.018 | 0.03 | 3.9 |
| GRU4Rec | 516K | 5.31 | 0.069 | 2.47 | 0.005 | 0.047 | 4.9 |
| SASRec | 597K | 11.6 | 0.64 | 4.23 | 0.023 | 0.221 | 5.5 |
| DuoRec | 597K | 27.21 | 1.721 | 4.06 | 0.566 | 0.765 | 6.2 |
| LRURec | 592K | 71.78 | 1.279 | 5.62 | 0.023 | 0.22 | 19.4 |
| Mamba4Rec | 557K | 68.72 | 1.699 | 7.45 | 0.022 | 0.249 | 20.0 |
| HSTU | 556K | 20.58 | 0.798 | 4.62 | 0.022 | 0.32 | 8.6 |
| FWPRec (Ours) | 567K | 13.13 | 0.763 | 3.36 | 0.023 | 0.102 | 6.0 |
KuaiRec · batch 256
| Model | Trainable params | Train s/epoch | Peak train GB | Infer ms/batch | Avg infer GB | Peak infer GB | Total train min† |
|---|---|---|---|---|---|---|---|
| Popularity | 0 | · | · | 0.04 | 0.001 | 0.002 | 4.8 |
| ItemKNN | 0 | · | · | 615.74 | 0.001 | 0.002 | 27.1 |
| BPRMF | 90K | 5.24 | 0.049 | 0.11 | 0.002 | 0.015 | 6.5 |
| GRU4Rec | 25K | 26.95 | 0.057 | 2.88 | 0.002 | 0.029 | 7.8 |
| SASRec | 106K | 31.58 | 0.326 | 2.38 | 0.019 | 0.119 | 9.0 |
| DuoRec | 106K | 76.42 | 0.869 | 2.32 | 0.294 | 0.393 | 14.0 |
| LRURec | 101K | 144.44 | 0.648 | 5.84 | 0.02 | 0.118 | 26.0 |
| Mamba4Rec | 66K | 244.44 | 0.854 | 8.07 | 0.019 | 0.132 | 35.7 |
| HSTU | 65K | 46.81 | 0.405 | 2.38 | 0.019 | 0.168 | 9.3 |
| FWPRec (Ours) | 83K | 98.74 | 0.393 | 3.33 | 0.019 | 0.064 | 12.4 |
Fine print
† mean wall-clock of the three published final seeds, including per-epoch validation and early stopping — so it reflects what the runs actually cost, not epochs × epoch-time. Trainable parameters exclude the frozen Qwen table (identical for every model on content columns); on KuaiRand all item tables are learned, so counts include them. Popularity and ItemKNN involve no gradient training; their fit happens at construction. Batch sizes are each column's published training batch size. Average inference memory is the steady-state allocation sampled after each timed batch (resident weights and buffers); the peak is the transient forward-pass high-water mark.
Paper figures
Publication versions of this page's charts, as PDF. Each series or cell is encoded twice (colour plus pattern, marker or printed value), so they read in greyscale and under colour-vision deficiency. Click a preview to open the PDF.